As writers, we don't often realise the amount of data and numbers we need to crunch in order to run a successful business. Many of us shy away from numbers, preferring words. But understanding how to analyse data is critical for business success. Today, the Alliance of Independent Authors AskALLi team welcomes Ricardo Fayet from Reedsy to explain analytics for authors.

Ricardo Fayet co-founder of Reedsy
Analytics for Indie Authors
As indie authors, we tend to be pretty good with words. Numbers, however, can be a different story. If you want your writing to pay the bills, though, you’ll need to treat it like a business. And a business ultimately runs on… numbers.
When you’re trying to understand which areas of your business are doing well, which advertising avenues are driving sales, or which of your books — or series — have the best potential for success, numbers (and sometimes a bit of math) will be your allies.
Don’t worry, though: in this post, I’ll break down 9 of the most important metrics that all indie authors should know how to use — and explain how to use them to analyze your business performance.
Business Metrics
Let’s start with two overarching metrics that can tell you the most important thing you need to know: whether your publishing business as a self-published author (and your investments in particular) is profitable or not.
Profit and Loss
Profit and loss are straightforward metrics. They’re the result of the difference between your total income and your total expenditure:
Profit or loss = total income – total expenses
If the resulting number is positive, it’s called profit. If it’s negative, it’s a loss. For those of you familiar with accounting, it is the final line that will show on your P&L statement (which stands for… you guessed it: Profit & Loss).
So what qualifies as income? Anything you earn from your writing and publishing activities, from royalties on book sales (or page reads), to advances on subsidiary rights deals, merchandising sales from your online store, or even sales of courses related to your books.
As for expenses, well, it’s any money you spend on your business: from production costs (editing, illustration, cover design, narration, translation, etc.), to marketing, research (travel, conferences, etc.) or software.
This profit/loss reasoning isn’t just useful for your business. It can also be applied to specific marketing activities. For example, if you spend $10 on Amazon ads, and these result in $20 of income, you can say the ads generated a profit of $10.
Return on Investment (ROI)
The return on investment (or ROI) is a similar metric to the profit/loss, but only applies to specific expenses (investments). Instead of just subtracting the expense from the income, it expresses the difference as a ratio.
ROI = (income from investment – cost of investment) / cost of investment
In our Amazon ads example above, the ROI would be: ($10 – $5) / $5 = 100%.
ROI is always presented as a percentage, which may be positive (if the investment is profitable), or negative (if the investment is loss-making) — and, in theory, should be used more for actual investments rather than expenses.
For example, you could calculate your ROI on a foreign language translation, or on an audiobook, or on a special edition hardback, by comparing your total income from that translation/audiobook/hardback to how much it cost you to produce.
Reading Metrics
The next two metrics are among my favorites, because they are not only important from a business perspective — they shine a light on how readers read your books.
 Read Through
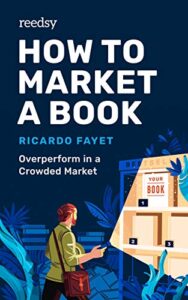
Read through is, by far, the #1 metric every series writer should pay attention to. I explain its importance in-depth in my first book, How to Market a Book: Overperform in a Crowded Market:
“Read through (RT) is the percentage of readers of a given book in your series who go on to read the next book.
For example, if one hundred people read your first book and seventy-five of them go on to buy and read your second one, your read through from book one to book two is 75 percent. Then, if sixty of these seventy-five end up reading book three, your read through from book one to book three is 60 percent.
At its core, read through is the best scientific measure of how “unputdownable” your series is. If 80 percent of readers who buy book one go on to read your entire series, then you’ve created something that turns four out of five casual readers into hardcore fans.
You should regularly monitor read through across your whole series (and not just from book one to book two), as that will tell you where you start losing the most readers. For example, if RT from book one to book four is 60 percent, but only 25 percent from book one to book five, then you know you’re losing a ton of readers at book four! Again, there can be hundreds of different reasons for that, and RT alone won’t tell you which one it is or how to fix it. But at least you’ll know there’s a problem.”
You can measure read through in a couple different ways: either you compare your orders volume, or you compare your Kindle Unlimited reads/borrows. Which brings us to…
KU/Sales Ratio
For those of you enrolled in KDP Select, another useful metric is the KU/sales ratio: it effectively measures which percentage of your reader base reads your books through Kindle Unlimited, versus purchasing them.
KU/sales ratio = borrows/sales
If that ratio is greater than 1, it means you get more borrows than sales… and vice versa.
What’s important to note here is that Amazon does not disclose the number of borrows you get through KU. Instead, you need to calculate it by dividing the total page reads you got on the book, by the book’s length in Kindle Edition Normalized Pages (KENP).
So for example, if a book that is 300 KENP long had 500 sales and 300,000 page reads in the past month, we can estimate that it had 300,000/300 = 1,000 borrows, and therefore a KU/Sales ratio of 2. It gets twice as many KU readers as non-KU ones.
As a note, if you have a high KU/Sales ratio, it makes more sense to calculate your read-through using reads (or borrows) figures, rather than sales, considering you’ll have much more data.
Advertising Metrics
Now you know how to evaluate your business performance, and your reader habits, let’s dive into advertising!
Cost per mille (CPM)
The Cost per Mille, or cost per thousand impressions, is an often overlooked advertising metric, and yet for platforms like Meta (i.e. Facebook and Instagram) or BookBub, it determines how much the platform charges you.
The CPM effectively represents how much you pay to earn 1,000 impressions (i.e. 1,000 “views” of your ad).
CPM = (spend / impressions) x 1,000
Meta, as well as a majority of other advertising platforms, charge on a CPM basis — meaning that you pay based on impressions, not clicks. Therefore, the more impressions you can get for your spend, the better! In other words, the lower your CPM, the better.
A lower CPM effectively means that you are spending less money to reach more people. It is usually a sign that your ad has a high quality score, or that you are targeting a non-competitive audience.
Click Through Rate (CTR)
The CTR is the ratio from impressions to clicks:
CTR = clicks / impressions
It is often used to judge the attractiveness of an ad, as it effectively measures how likely viewers are to click on it. The higher the CTR, the fewer times your ad needs to be seen to receive a click. As such, a lower CTR will generally always translate to a lower cost per click.
Cost Per Click (CPC)
The cost per click is probably the most famous advertising metric. It represents how much you pay for each click your ads generate.
CPC = spend / clicks
On Facebook or BookBub ads, where sales are not reported, authors often use the CPC as the main metric to judge their ads’ performance: the lower they can get it, the more traffic they are driving to the book page.
This sort of ignores the other part of the equation: whether these readers who land on the book page actually convert into readers.
Conversion Rate
The conversion rate is another metric that is often overlooked by authors, most likely because no retailer actually discloses it to its authors. It represents the ratio of buyers (or borrowers, for KU) compared to the total traffic (or eyeballs) on your book page.
Conversion rate = (sales + borrows) / traffic
For example, if 100 people check out your book page, but only two buy the book, the conversion rate would be 2%.
While Amazon (nor any other retailer) don’t give you any stats on conversion, you can estimate it for specific marketing channels by using a tool called Amazon Attribution.
“Amazon Attribution allows you to generate special product URLs to use in your marketing and advertising campaigns. After a few days, Amazon will showcase all the traffic that visited these links, as well as resulting orders and sales value.
What is important to understand about Amazon Attribution is that it won’t give you data on all your Amazon sales. It will only report on the sales coming from the trackable links you set up within the tool.
In other words, if you send a newsletter about your book, the only way to know how much traffic and sales resulted from that newsletter is to use a specific Amazon Attribution link in it. The same goes for other marketing channels such as Facebook ads, TikTok videos, or promotion sites.”
Advertising Cost of Sale (ACoS)
ACoS stands for “advertising cost of sale,” and is a simple ratio of spend divided by sales. It is mostly used for Amazon Advertising, but can apply to any advertising channel.
ACoS = Spend / Sales
If the ACoS is lower than 100%, it means your sales are greater than the cost to generate them — so, in theory, your ads are profitable. Similarly, an ACoS of exactly 100% should, in theory, mean you’re breaking even.
 I say “in theory” because this depends on what you consider the sales value to be. To quote from my second book, Amazon Ads for Authors: Unlock Your Full Advertising Potential:
“What Amazon reports as Sales is the total retail value of the products sold as a result of the ads. Since this figure is based on the price of each product, it includes not only the royalties distributed to the author, but also the printing, shipping, and distribution costs.
In other words, you only earn a fraction of what Amazon reports as Sales.
In the broader advertising world, the ACoS is extremely useful because it tells you, at a glance, whether a campaign is making or losing you money. However, on Amazon Advertising specifically, the ACoS is far from being as helpful, as it is calculated based on the total Sales value, not your actual revenue. As such, an ACoS of 100% actually signals that you’re losing money — not breaking even.
Worse, the ACoS doesn’t take KENP royalties into account, making it effectively meaningless for Kindle Unlimited authors who earn the majority of their income through page reads.”
So what’s a good ACoS to target with your Amazon Ads? That’s the most important, and sometimes most complicated, thing to figure out — and you’ll have to read the book for that.


