


Karen Myers shares her expertise in tracking book sales
An important part of managing your author business is tracking book sales, not least so that you know which of your marketing strategies and tactics are working, and which of your books are proving most popular, so that you can step up whatever's working best. This kind of activity may not come naturally to many indie authors, so we're pleased to share Karen Myers‘ clear and detailed guidance on how to do it.
![]() One frequent question from new independent writers is “What tool can I use to track my book sales?” They're looking for the right tool to fetch and consolidate all of their sales data.
One frequent question from new independent writers is “What tool can I use to track my book sales?” They're looking for the right tool to fetch and consolidate all of their sales data.
In genealogical circles, a similar question is “Who can tell me about my family's ancestry?” and it's the subject of an amusing and sardonic tall tale that tells of the search for the file that contains all the answers.
The same answer applies to both: “Sorry, buddy, you gotta do all that work yourself. Nobody's already done it for you.”
If you're only distributed by one retailer, like Amazon, or you're using one of the current tools that make a serious effort to capture some (but not all) of your unit sales — and that satisfies you — then this is not the article for you. I won't be critiquing the currently available tools because none of them can provide a single platform for tracking ALL your sales in ALL your channels, nor provide you with all the information you want to track, if you can.
You're going to have to build that yourself.
Let's start by exploring what, in an ideal universe, you would want to track about your book sales over time, and why.
Goals
The devil's in the details…
Sales by month (units and $)
Surely it's not too great a burden to go to each of your channels just after the end of the month to get your basic numbers. For me, that's
- Direct: Amazon, Barnes & Noble, Kobo, Smashwords
- Distributors: (Kobo, Smashwords), PublishDrive, StreetLib, IngramSpark, and AuthorsRepublic (audio)
But that doesn't really tell you much except what to expect on a royalty statement when you get paid. Nor does it account for other kinds of sales, such as direct sales at a book fair, books sold on consignment in local stores, or your ecommerce sales. So that's incomplete.
And it also doesn't provide the information you need to draw trend and analysis data, unless you keep such details as Title, Format, Price, Language, etc.
For marketing and promotional purposes, you also want to see the details of “which retailer” for the distributors, as well as the country.
Financial Systems
Then there's the question about what level of detail should get into your actual accounting system, vs tracking and analysis. After all, when royalties arrive, you have to record them somewhere. Your accounting system is where you track money, but it's not a good place for all the non-financial detail. It cares about monthly sales by royalty payer, not the details about individual channels.
You need two levels of information:
- Simple per-royalty-payer financial information and physical inventory tracking (those book boxes in your garage)
- Highly detailed sales information at the deepest level available from your channels and distributors
Analysis
Until you start playing with detailed data, you won't be aware of what questions you can ask of it. I get monthly, annual and lifetime answers to things like:
- Units / Earnings by title, format, country, retailer, distributor, distributor-class (direct sale, etc.)
- Percentage comparisons among all these categories
- Growth/Shrinkage over time
- Series uptake analyses, and comparisons in uptake between different series
- Average costs and proceeds by title/format
- Variable Annuity analysis: does my investment in labor and cash for each title make back at least 10% (in aggregate) each year
Flexibility
Adding another retailer or distributor or a new title or format is trivial. You can add titles you publish for someone else and track just your part of the royalties.
The System
So, how does this work? What do you need to build?
I recommend a spreadsheet (I use Excel — I don't know what other spreadsheet vendors are capable of). The most sophisticated skills I use in that spreadsheet are lookups and pivot tables, so if those are new to you, you'll have to expand your knowledge of spreadsheets a bit.
My version is idiosyncratic to me. If you contact me directly via email I will send you a copy of my own spreadsheet for guidance, as long as you keep the numbers confidential and do not further distribute it without contacting me again. My spreadsheet is NOT a commercial product. An overview tab that explains it is included, but this spreadsheet will not be suitable for you to copy directly — your brain and my brain will have different slants and preferences — but it can serve as a model for how to build your own, in a way that suits you.
The Core
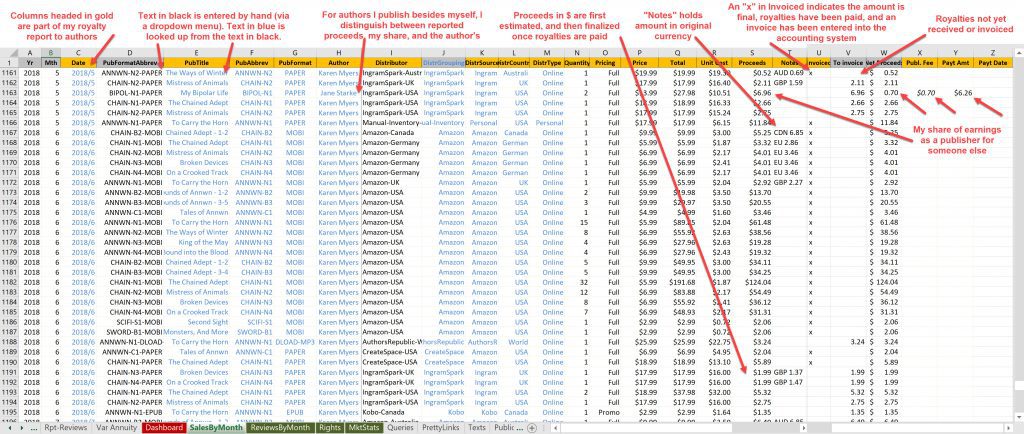
The SalesByMonth tab is the heart of the system. It feeds all the pivot tables and the dashboard (below).
Click to expand
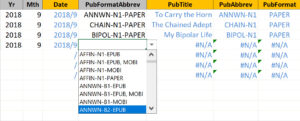
 Dropdowns/Lookups – I have tabs with lists of lookup choices for the black text columns.
- Primary inputs – The spreadsheet excerpt above is a bit more than one month (column B – June, 2018) for all my sales for all my channels, at the maximum level of detail available from my broad worldwide distribution. I have 25 titles, and that's fewer than 30 rows in a month. You may have many more unit sales to report, but is that just quantity, or additional vendors/locations (rows)? It's not a lot of entry, and when the royalties are reported, it's easy to match them up and finalize the amounts. Personally, I update the Amazon rows more frequently than monthly, just to get the buzz and to keep the dashboard up to date.
- Driving publisher royalty reports – Each month, I filter the spreadsheet by author, copy the gold column data into a publisher royalty sheet for that author, and add payment details (I pay authors once I receive royalties — notice that royalty for a 5/2018 sale through IngramSpark has not yet been paid to me). If an author ever wants more information, it's trivial to tie it back to the original vendor reports, and it's transparent for the author.
 Dropdowns/Lookups – I have tabs with lists of lookup choices for the black text columns.
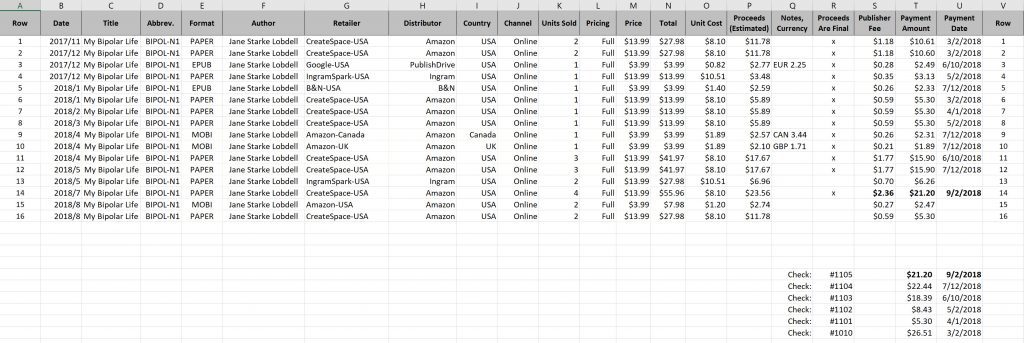
Click to expand
Analyses
 Pivot tables galore. Too much of my data is there to comfortably expose here in public, but here's a taste of the sort of chart you can pull from pivot data, and a list of the pivot tables I keep track of.
Dashboard
All my vital statistics at a glance.
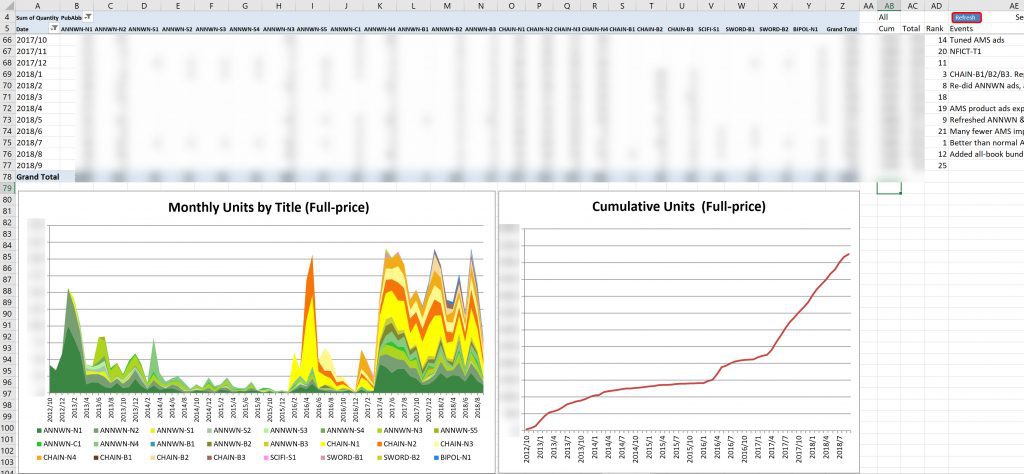
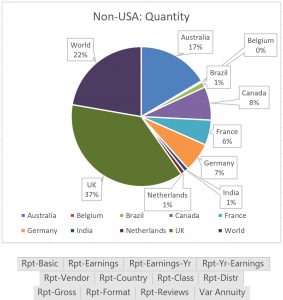
At the top is a pivot table which is matched by the graph below.
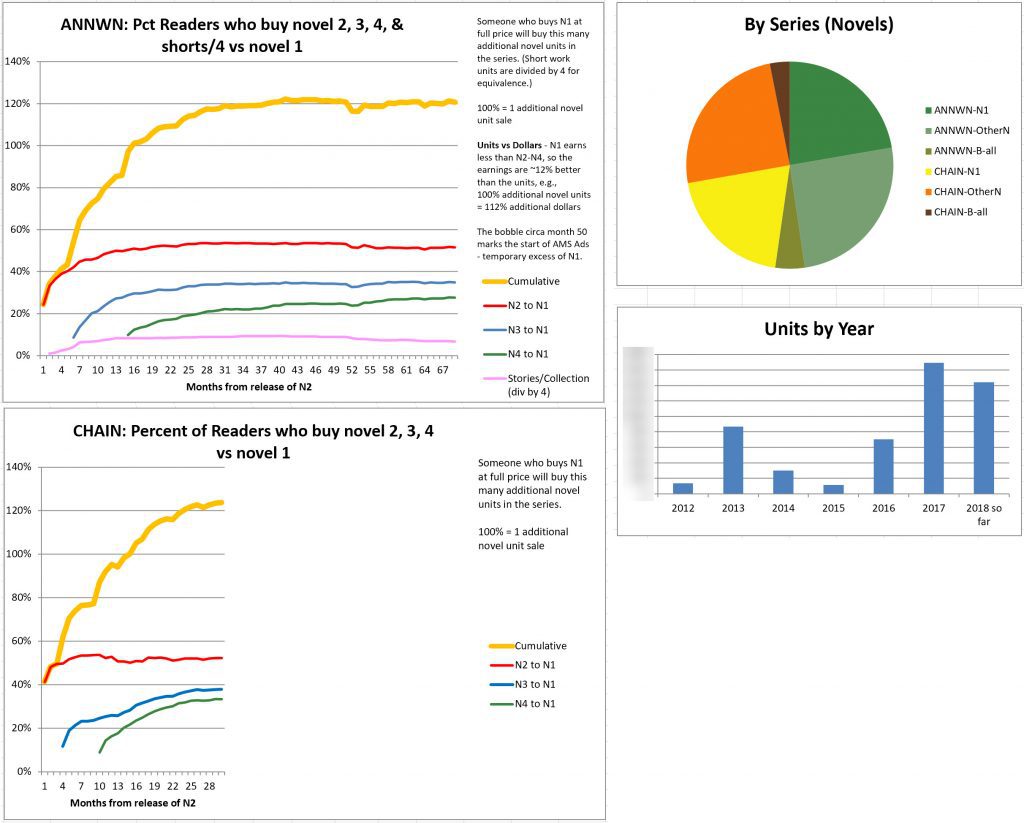
I've included other charts as if they were widgets. For example, here's an analysis of series uptake for two different series, demonstrating that series uptake is very similar for both of them, as well as a look at Units Sold by Series, and Total Units by Year.
Bibliographic data
As most of us do, I keep a list of all data about individual titles (ISBNs, page counts, publication dates, etc.) in one tab, and another list of texts (book descriptions, metadata, etc.) in another tab. Since that's my authoritative source for titles and formats, I include them in this fundamental spreadsheet as one of the sources for lookups.
Connections to the Accounting System
A tracking system like this is only coupled to your accounting system at a few of the edges.
- Invoicing. The SalesByMonth tab above operates on estimated amounts until the royalties are actually paid and currency conversions and other issues are finalized. At that time, I issue an invoice for that vendor in my accounting system and mark it paid, and update/correct and mark as “final” the amounts in my spreadsheet.
- Publisher reports to authors. The amount due comes from the SalesByMonth tab (see above), and the record of each “bill” and payment is part of your accounting system.
- Variable Annuity analysis. This calculation is a percent that requires the cost of the investment vs its earnings. The earnings come from the SalesByMonth tab. The investment cost is comprised of actual out-of-pocket cash which is tracked in the accounting system, and of labor hours times a theoretical rate for manuscript creation, edit, format, and so forth. I keep track of that last bit (in summary) in the VarAnnuity tab, and at year-end, I update the accounting data by title for new costs to make the annual calculation.
In Conclusion
It's a significant investment to make a spreadsheet like this and to tinker with it from time to time. But what would you expect for the analysis tool that is the heart of your business? All companies have tracking systems, and they all tailor them to their particular needs. Our businesses are no different.
Hoping to find a tool out there that covers all the idiosyncracies of your own situation is a fool's errand — at best it might cover a significant percentage. But if you can get all of it, at the maximum level of detail, without incurring a huge monthly investment, why wouldn't you?
It's the tool you need.
Karen Myers writes with clarity and insight about many different aspects of running an indie author business on the “Just For Authors” section of her author website, www.hollowlands.com/category/just-for-writers/.
OVER TO YOU Do you have any top tips to add to Karen Myers' advice? Feel free to share them here!
#Indieauthors - struggling to keep track of your sales? This clear advice from Karen Myers of @HollowlandsBook will make life much easier for your! #bookmarketing #authorbusiness Click To TweetOTHER USEFUL POSTS ABOUT RUNNING AN AUTHOR BUSINESS
From the ALLi Author Advice Center Archive
https://selfpublishingadvice.org/author-earnings-through-author-business/


I would love a copy of your spreadsheet as well, if it’s still available. Thank you!
This is fantastic. I’d love a copy if it is still available. Thank you!
Would love a copy of your spreadsheet!
Great article and an impressive looking spreadsheet. Can you please forward me a copy? Many thanks!
Thank you for the informative information,
a look at the Excel spreadsheet would be appreciated.
thank you for taking the time to send it.
I’m an artist and am working writing and illustrating 2 children’s books and doing illustrations for 3 educational music books (a friend is the author)
So I’m trying to get all the administrative things that make creative folks like me go “eeeek” figured out ahead of time.
Thanks you so much for the informative article, being new to self publishing this was extremely helpful!! I would love to have a copy of your spreadsheet template..
Please send me a copy of your Excel spreadsheet
This is impressive! I also keep a spreadsheet. Well actually several spreadsheets–one overall like this (though admittedly not quite as complex) and then a separate spreadsheet for comparing specific marketing events I run in a year.
I do have one question on yours. That is what assumptions you make to do tracking by series read through. Do you use a time delimiter (e.g., 90 days) and say if Book 1 was bought in May, then all books in series purchased by August are counted? Or is it related to a specific marketing event like a BookBub and you assume that any books purchased in the 7 days following count as read through? Obviously, you don’t have any way to track if a specific reader who purchased a book then goes on to buy others in series unless it is direct sales. I’ve been playing around with different time delimited scenarios and haven’t hit on one that I feel is quite right so would love to hear your criteria.
I also use a spreadsheet to track my sales and love those pivot tables! I don’t analyze in quite the detail you do, but I do keep track of country, sales channel, royalty percentage, and currency earnings so that I have a great deal of information at my fingertips. It’s well worth the time I spend on it when it comes to decision-making. An extra benefit is that if my accountants need specific info I can usually supply it very quickly.
And all I need is Excel! My Office 365 subscription costs around £80 a year (less than $100) and includes a ton of storage and the ability to share with the other power Excel user in the house. I recommend getting the latest version of Excel as the pivot table function is much easier to use in the more recent versions. Although a Mac user, I much prefer Excel to Numbers and it makes importing, exporting and sharing far easier.